Pull up three different sources for "Monterey home prices" this week and you will get three different numbers, and they won't just disagree at the margins. One says the median sale price is climbing. Another says it's down more than 30 percent from a year ago. A third puts the average value somewhere in between and calls it flat. None of them are wrong. They're measuring different things, in a market small enough that a handful of closings can swing the headline.
That instability is not a footnote. It's the actual story for anyone comparing Monterey against Pacific Grove or Carmel, or trying to figure out where within Monterey to even start looking. The city's median price is not one market. It's an average of at least three very different ones, stacked inside a few square miles, and the gap between them tells you more than the topline number ever will.
Why the Same City Produces Contradictory Headlines
Start with the plainest evidence. MLSListings data for Monterey in June 2026 put the single-family median sale price at $1,265,000, up 4.5 percent year over year, with homes moving fast: a median of 13 days on market and a 99 percent sale-to-list ratio on 19 closed sales that month. A separate spring 2026 market analysis, pulling from the same underlying MLS but a different window, showed single-family median sale price at $1,190,000 with 21 median days on market. Both are accurate. Neither is the whole picture, because Monterey closes so few single-family homes in any given month that the median jumps around depending on exactly which 19 or 36 houses happened to sell.
Zillow's home value index, updated through June 30, 2026, shows something different again: an average home value of $1,180,394, down 1.6 percent over the past year, with a median list price of $1,048,167 and inventory sitting at 89 homes. List price, sale price, and a modeled value index are three separate measurements, and in a market this thin they don't converge cleanly.
The practical takeaway isn't that any of these sources are unreliable. It's that a single median, quoted without its window and its category, tells you almost nothing about what you'd actually pay for a specific kind of house in a specific part of town. You have to break the number apart before it becomes useful.
The Average and the Median Are Telling Two Different Stories
Here's where it gets interesting for anyone comparing neighborhoods rather than just checking a number. That same spring 2026 analysis flagged something worth sitting with: Monterey's median single-family sale price was $1,190,000, but the average sale price was $1,560,000. A gap that size means a small number of high-end sales are pulling the average well above what a typical buyer will actually pay.
That matters if you're using "average home price" to compare Monterey against another Peninsula city. You might think you're comparing typical inventory when you're really comparing against a handful of oceanfront or view-lot outliers that happened to close that quarter. The median is the more honest number for figuring out what a normal transaction looks like. The average is more useful for understanding how much upside sits at the top of the market. Confusing the two is an easy way to misjudge what your budget actually competes against.
One Median, Two Very Different Housing Markets
Monterey's median price also blends two property types that behave almost nothing alike. The same MLSListings snapshot for June 2026 showed condos and townhomes selling at a median of $675,000, a fraction of the single-family median, but taking longer to do it: 23 median days on market against 13 for detached homes. The spring 2026 analysis found a similar pattern, with attached homes carrying a median sale price of $545,000 against a median of 42 days on market and 4.7 months of inventory, compared to 3.6 months for single-family stock.
Part of the reason is Monterey's buyer pool. The city's proximity to the Naval Postgraduate School and the Defense Language Institute keeps a steady stream of shorter-term residents and renters cycling through, which supports condo demand but also means that segment behaves more like a rental-adjacent market than the single-family market does. If you're shopping the attached-home category expecting single-family urgency, you'll misread the pace. If you're shopping single-family expecting condo-level breathing room, you'll lose houses you actually wanted.
What Monterey's Micro-Markets Actually Look Like
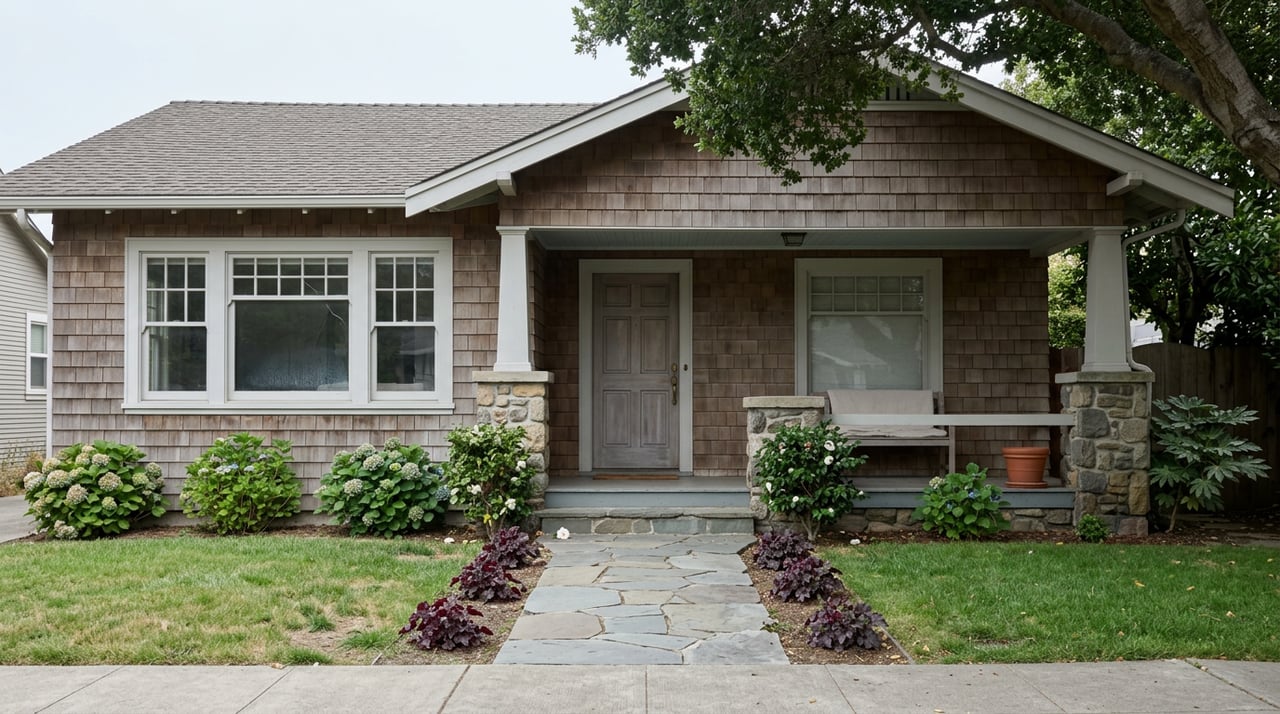
Locally, Monterey splits into named districts that behave more like separate small towns than subdivisions of one median. Old Monterey, the downtown core, is where the adobes are: cobblestone-adjacent streets, Colton Hall, the Larkin House, and Alvarado Street as the main commercial spine, with a housing stock that leans historic and walkable. New Monterey sits just west, built up later in the late 19th and early 20th centuries, with Lighthouse Avenue as its own commercial strip and Cannery Row running along its coastal edge, mixing older housing with condos closer to the water. Further east, the Del Monte Beach area and the Highway 68 corridor carry a different mix again, from Craftsman bungalows to newer ranch-style homes, some with bay views, closer to El Estero Park and the Del Monte shopping district.
That range is exactly why one Peninsula market analysis, written in March 2026, described Monterey as offering the most variety of any city on the Peninsula, from historic downtown condos near Cannery Row and Old Fisherman's Wharf to larger single-family homes near Del Monte Beach and the Highway 68 corridor. Comparing a condo near Cannery Row to a single-family home near Del Monte Beach using one citywide median is like comparing two different products with the same label.
The Discount Hiding in Plain Sight: Casanova Oak Knoll
The clearest example of a friction that only shows up once you're inside a neighborhood, not scrolling past it, is Casanova Oak Knoll. It sits east of the Monterey Pines Golf Course, a beginner-friendly course managed by the U.S. Navy, and not far from the Del Monte Golf Course, established in 1897 and among the oldest golf courses on the West Coast. The neighborhood is flat, walkable, and roughly two miles from the beach, with its own park, Casanova Oak Knoll Park Center, offering a playground and picnic areas.
By every reasonable measure, that's a desirable combination: walkable, golf-adjacent, close to the water. And yet single-family homes here have traded in the $750,000 to $1.2 million range, with condos running $450,000 to $600,000, both well below what comparable walkable, beach-proximate housing commands elsewhere on the Peninsula. One tracking source put the 12-month median sale price at $870,000, up 29 percent from the prior year, while a separate snapshot from March 2026 showed a median closer to $672,500, another reminder of how much a single month's closings can move the number in a low-volume neighborhood. Homes here have also been moving faster than the national average, with a typical 43 days on market against a national benchmark of 54.
The reason for the discount isn't hidden once you know to look for it: Casanova Oak Knoll sits directly north of Monterey Regional Airport, and the neighborhood's housing stock, mostly single-level ranch homes built in the early 1950s, is older than much of what's competing against it. That's the kind of friction a listing photo will never show you and a median price will never explain. It only surfaces when someone who knows the streets tells you why a walkable, golf-adjacent, near-beach neighborhood is priced the way it is.
A Few Questions Worth Asking Before You Compare Neighborhoods
Should I compare Monterey to other Peninsula cities using the average or the median price? Use the median first. With average sale price sitting roughly $370,000 above median in the most recent spring 2026 data, the average reflects a handful of high-end closings more than it reflects a typical purchase.
Why do condos in Monterey take longer to sell than single-family homes? Condo and townhome inventory serves a different buyer pool, shaped in part by the Naval Postgraduate School and Defense Language Institute nearby, and it carries more months of supply, 4.7 months versus 3.6 for detached homes as of spring 2026, which naturally stretches days on market.
Is a lower price in a neighborhood like Casanova Oak Knoll a red flag? Not necessarily. It reflects specific, identifiable factors, mainly airport proximity and the age of the housing stock, rather than anything about the neighborhood's walkability or amenities, which by most measures are strong.
Where This Leaves You
A median price is a starting point, not a strategy. If you're comparing Monterey to the rest of the Peninsula, or comparing one Monterey street to another, the number that matters is the one specific to your property type, your target neighborhood, and a window recent enough to trust. That's the kind of comparison that's hard to do from a portal search and easier with someone who tracks these blocks month to month.
If you want to talk through what a specific Monterey neighborhood is actually doing right now, not what the citywide average implies, Dave Lucas is a good place to start. Let's Connect.